
With HRX gaining momentum, I was curious as to whether I could use HRX backed FastFlowLM already. And since I maintain the FastFlowLM rpm on copr, I figured why not package both as FastFlowLM does not allow for dynamic loading the backend at runtime.
And once you have one source RPM producing two backend subpackages, the speed question costs nothing to ask: same build, same machine, same model, same benchmark, swap the runtime underneath and run it again. So I did, on a Strix Halo where both runtimes work, and then did it twice more, because the first pair turned out to have another workload resident on the box and the second pair turned out to depend on the power profile. It is a small run: n = 3, one model, one context size, three box states. You can see the raw results on the page linked below.
HRX
What HRX is, and why a second runtime at all
Upstream describes hrx-system as "a collection of minimal runtime components providing an alternative implementation of HIP as it presently ships within ROCm", meant as "a common substrate for low latency, high performance integration with AMD's GPU, NPU, and CPU products". It is built on IREE's hardware abstraction layer and exports libhrx.so, a native C API; libamdhip64.so, a HIP compatibility binding so existing HIP programs run on it without relinking; and hrx-info, which lists devices and runs smoke tests. Apache-2.0 with the LLVM exception, and marked early-access, with the warning that API, packaging and deployment details will move. One driver is active per process: HRX_GPU_DRIVER if set, otherwise the first one compiled in.
The part that matters for the NPU is not in any release. The 0.3.0 release documents one AMD driver, AMDGPU. The AMDXDNA driver, the one that reaches the NPU through the amdxdna kernel module and /dev/accel/accel0, lives on the amdxdna-hal-native-rel branch. FastFlowLM doesn't build it; it pins a prebuilt release of that branch on a developer fork (jtuyls/hrx, tag flm-hrx-amdxdna-v2026.07.30, built at eb0b39f). My hrx package carries the version string 0.3.0 but is built from the branch head, 6867cba, some six thousand commits past the tag, with -DIREE_HAL_DRIVER_AMDXDNA=ON. Getting FastFlowLM to load a model on it took patches on both sides: an allocator change in hrx 0.3.0-6 that turns FastFlowLM's host-local buffer requests into plain DRAM buffers instead of rejecting them, and a FastFlowLM patch that drops the flag and sets HRX_GPU_DRIVER=amdxdna. So the HRX under FastFlowLM here is not the HRX FastFlowLM's own releases test against. That caveat travels with every number below.
One more thing to keep apart. lemonade 11.9.0 ships its own llamacpp-hrx backend, llama.cpp running on HRX's GPU driver. This post is about FastFlowLM's NPU backend linked against libhrx. Same runtime, different driver underneath, and a different program on top.
Today the AMD NPU on Linux is reached through XRT, a runtime with FPGA ancestry: xclbin partitions, a hardware-context request the kernel can reject, five subpackages in my packaging of it. The GPU is reached through ROCm and HIP. HRX is the first thing I have seen that compiles both drivers into one library behind one C API, small enough to read. For FastFlowLM it is also, today, the path that works on hardware where XRT's context request does not.
Setup
What was actually compared
One SRPM, fastflowlm-1.0.4-2.git.1.bf7fe0e.fc44, builds three packages. fastflowlm is the model registry and the flm entry point. fastflowlm-xrt and fastflowlm-hrx each carry a complete backend, the per-model engine libraries under /usr/lib64/flm/<backend>/ with the same file names in both, and register /usr/bin/flm-xrt or /usr/bin/flm-hrx as an alternative for flm. The base package requires (fastflowlm-xrt or fastflowlm-hrx), a boolean dependency, so either satisfies it and both can be installed at once. With both installed the automatic choice is HRX, priority 20 against XRT's 10. alternatives --set flips the group to manual, after which package updates stop moving it.
lemonade doesn't call the system flm. It runs its own copy from ~/.cache/lemonade/bin/flm/npu/flm, a wrapper script in a tree it downloads on first use, next to a version.txt it compares against the pin in its resources/backend_versions.json (v1.0.3 for 11.9.0). Replace the wrapper with a symlink to the packaged binary and leave version.txt reading the pinned version. If the two disagree, lemonade reinstalls the tree and the symlink goes with it. From then on the alternatives switch decides which runtime lemonade uses:
The split exists because the two backends link against different runtimes (libxrt_coreutil.so.2 against libhrx.so.0) and ship engine libraries under identical names. Separate subpackages with RPATH-isolated library directories keep the symbols apart, and alternatives gives the rest of the system one switch, flm, to depend on. The benchmark is that switch flipped between two otherwise identical runs.
The host is an AMD Ryzen AI MAX+ PRO 395 (Strix Halo) with 128 GiB of unified memory, Fedora 44, kernel 7.1.12 with the in-tree amdxdna module, NPU firmware 1.1.2.65, NPU power mode left at default for both runs. The model is gemma4-it-e4b-FLM as lemonade ships it, context 131,072. lemonade bench ran with its defaults: three measured runs per scenario, no warm-up runs, memory tracking on, and the model reloaded before every run (fifteen loads per backend in the log). Its scenario file lists 26 scenarios. Five text scenarios ran. The 13 image-generation ones were skipped with a message on both backends; the four long-context ones are excluded by the default (--scenarios all brings them in, and context-128k is the one I'd most want); the four embedding ones apply only to embedding models. Three states, one XRT and one HRX run in each. State 1, 3 September: another workload was resident on the box, which I only realised when its memory showed up in the HRX column. State 2, 4 September: idle box, balanced power profile. State 3, 4 September: idle box, performance power profile. Every comparison below is within a state; nothing sets a 3 September run against a 4 September one.
Decode
Decode: HRX is 4 to 7 percent slower, in every state
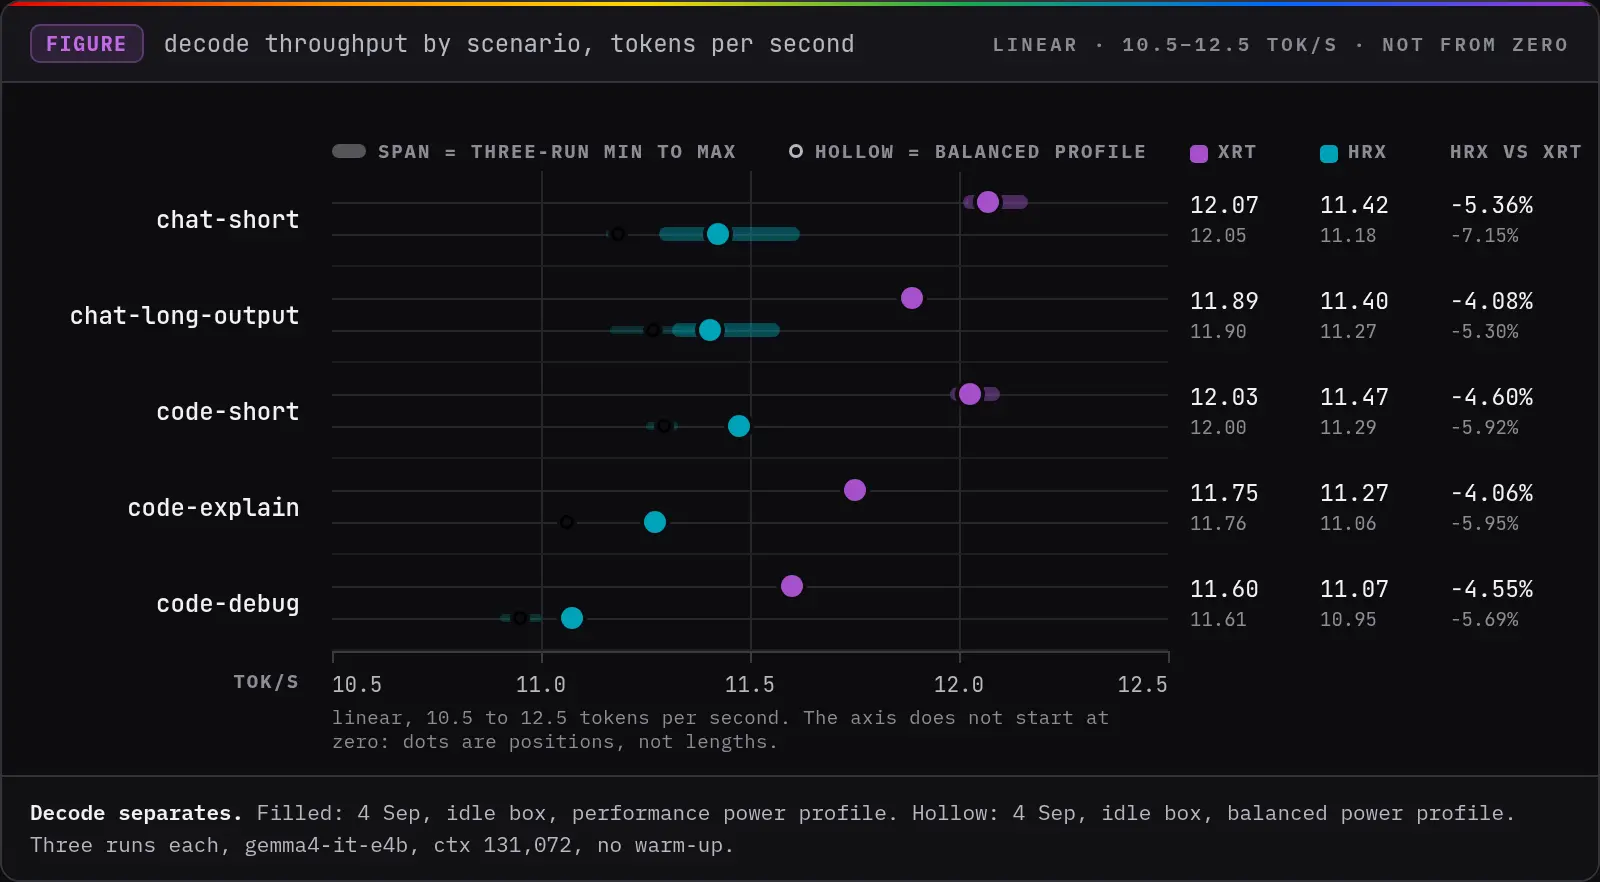
| Scenario | Output tokens | XRT mean | XRT min to max | HRX mean | HRX min to max | HRX vs XRT |
|---|---|---|---|---|---|---|
| chat-short | 20 | 12.07 | 12.01 to 12.17 | 11.42 | 11.28 to 11.62 | −5.36% |
| chat-long-output | 256 | 11.89 | 11.88 to 11.90 | 11.40 | 11.31 to 11.57 | −4.08% |
| code-short | 60 | 12.03 | 11.98 to 12.10 | 11.47 | 11.47 to 11.48 | −4.60% |
| code-explain | 128 | 11.75 | 11.75 to 11.75 | 11.27 | 11.27 to 11.28 | −4.06% |
| code-debug | 100 | 11.60 | 11.58 to 11.62 | 11.07 | 11.06 to 11.08 | −4.55% |
In every scenario the fastest HRX run is slower than the slowest XRT run. The same held in the other two states: −5.3 to −7.2% on the balanced profile, −4.9 to −7.0% with the workload resident, never an overlapping range. The state moves decode by at most 2.6% for either backend; the runtime moves it by 4 to 7%. Small, and not noise. Wall-clock duration follows decode: 56.4 s on XRT against 59.3 s on HRX summed over the five scenarios on the performance profile, 4.8 to 5.5% longer per scenario.
| Scenario | S1 XRT | S1 HRX | S1 Δ | S2 XRT | S2 HRX | S2 Δ | S3 XRT | S3 HRX | S3 Δ |
|---|---|---|---|---|---|---|---|---|---|
| chat-short | 12.27 | 11.41 | −7.02% | 12.05 | 11.18 | −7.15% | 12.07 | 11.42 | −5.36% |
| chat-long-output | 12.08 | 11.41 | −5.58% | 11.90 | 11.27 | −5.30% | 11.89 | 11.40 | −4.08% |
| code-short | 12.19 | 11.57 | −5.04% | 12.00 | 11.29 | −5.92% | 12.03 | 11.47 | −4.60% |
| code-explain | 11.94 | 11.36 | −4.85% | 11.76 | 11.06 | −5.95% | 11.75 | 11.27 | −4.06% |
| code-debug | 11.77 | 11.14 | −5.39% | 11.61 | 10.95 | −5.69% | 11.60 | 11.07 | −4.55% |
First token
First token: the box state matters more than the runtime
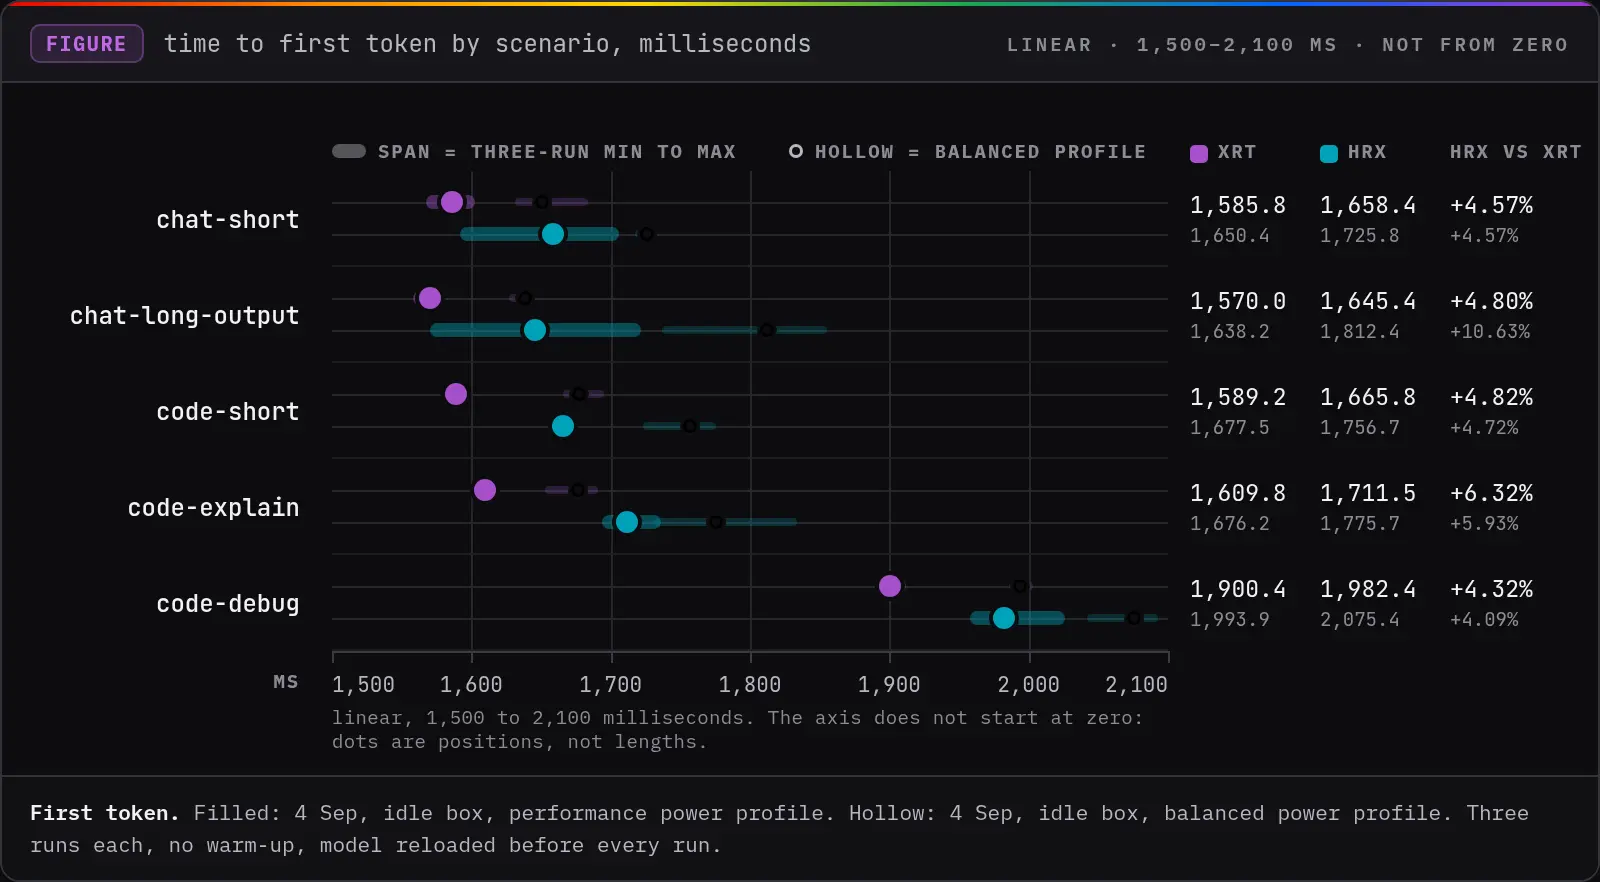
| Scenario | Input tokens | XRT mean | XRT min to max | HRX mean | HRX min to max | HRX vs XRT |
|---|---|---|---|---|---|---|
| chat-short | 28 | 1,585.8 | 1,567.6 to 1,602.9 | 1,658.4 | 1,592.1 to 1,705.9 | +4.57% |
| chat-long-output | 44 | 1,570.0 | 1,558.1 to 1,580.6 | 1,645.4 | 1,570.2 to 1,721.6 | +4.80% |
| code-short | 35 | 1,589.2 | 1,581.6 to 1,593.7 | 1,665.8 | 1,657.2 to 1,672.0 | +4.82% |
| code-explain | 208 | 1,609.8 | 1,604.4 to 1,618.3 | 1,711.5 | 1,693.7 to 1,735.8 | +6.32% |
| code-debug | 363 | 1,900.4 | 1,892.0 to 1,912.2 | 1,982.4 | 1,957.9 to 2,026.0 | +4.32% |
On the performance profile HRX reaches the first token 4 to 6% later in every scenario. The ranges overlap in the two chat scenarios, where HRX's three runs spread 6.9% and 9.2%, and do not in the three coding scenarios. I'd call that a real but small gap, and I would not have called it anything from the first pair alone.
| Scenario | S1 XRT | S1 HRX | S1 Δ | S2 XRT | S2 HRX | S2 Δ | S3 XRT | S3 HRX | S3 Δ |
|---|---|---|---|---|---|---|---|---|---|
| chat-short | 1,496.5 | 1,496.5 | −0.00% | 1,650.4 | 1,725.8 | +4.57% | 1,585.8 | 1,658.4 | +4.57% |
| chat-long-output | 1,480.7 | 1,507.1 | +1.78% | 1,638.2 | 1,812.4 | +10.63% | 1,570.0 | 1,645.4 | +4.80% |
| code-short | 1,488.5 | 1,473.8 | −0.99% | 1,677.5 | 1,756.7 | +4.72% | 1,589.2 | 1,665.8 | +4.82% |
| code-explain | 1,508.4 | 1,514.6 | +0.41% | 1,676.2 | 1,775.7 | +5.93% | 1,609.8 | 1,711.5 | +6.32% |
| code-debug | 1,805.0 | 1,817.7 | +0.70% | 1,993.9 | 2,075.4 | +4.09% | 1,900.4 | 1,982.4 | +4.32% |
Read that table across rather than down. With the other workload resident, the two runtimes tied within 1.8%. On the idle box under the balanced profile, both got slower to the first token, XRT by 10 to 13% and HRX by 14 to 20%, and a gap of 4 to 11% opened. Switching to the performance profile brought both back by 4 to 9% and left a 4 to 6% gap. So the profile explains part of the shift, and whatever that resident workload was doing to clocks explains the rest; both backends were still 5 to 10% slower to the first token on the idle performance box than they had been next to it. Decode did not care about any of this. I don't know what the workload was holding up, and these outputs can't say.
The shape is the same on both backends in every state: flat for prompts of 28 to 208 tokens, then a step of about 300 ms at 363. A fixed cost after the per-run model reload plus a prefill chunk boundary somewhere between 208 and 363 tokens would produce exactly this picture. --no-reload with one warm-up run would separate the two; warm-up alone would not, since warm-up runs get reloaded too.
Memory
Memory: equal, once nothing else is resident
lemonade's memory_peak_gb field, the highest of the five scenarios, on the idle box with the performance profile:
The first pair told a different story, and it was wrong. With the other workload resident, XRT read 17.0 to 17.2 GB and HRX read 30.0 to 30.5 GB, a ratio of 1.74 to 1.79 in every scenario, and I spent a paragraph not knowing why. The idle box answered it: HRX reads 16.7 to 17.6 GB on the balanced profile and 17.3 to 18.4 on performance, within 2 GB of XRT either way. The 13 GB was the workload, which happened to arrive between the XRT and HRX runs. vram_peak_gb says the same thing from the other side: 1.9 to 2.3 GB for both backends in the first pair, 1.0 to 1.3 GB for both on the idle box, so that 0.7 to 1.2 GB also travelled with the box, not the runtime.
| Scenario | S1 XRT | S1 HRX | S2 XRT | S2 HRX | S3 XRT | S3 HRX |
|---|---|---|---|---|---|---|
| chat-short | 17.2 / 1.96 | 30.0 / 2.27 | 16.9 / 1.22 | 16.7 / 1.08 | 17.2 / 1.27 | 17.5 / 1.22 |
| chat-long-output | 17.0 / 1.95 | 30.5 / 2.29 | 16.5 / 1.20 | 17.6 / 1.05 | 16.7 / 1.27 | 18.4 / 1.22 |
| code-short | 17.1 / 1.91 | 30.0 / 2.33 | 16.7 / 1.19 | 17.0 / 1.04 | 16.8 / 1.21 | 17.3 / 1.22 |
| code-explain | 17.1 / 1.89 | 30.3 / 2.31 | 16.8 / 1.19 | 17.2 / 1.04 | 16.8 / 1.21 | 17.5 / 1.22 |
| code-debug | 17.1 / 1.95 | 30.1 / 2.27 | 16.8 / 1.19 | 17.3 / 1.04 | 16.8 / 1.21 | 17.8 / 1.22 |
What those fields count is not documented. The lemonade CLI polls lemond's system-stats endpoint during a run, and lemond's strings show what it reads: MemTotal and MemAvailable from /proc/meminfo, and mem_info_vram_used and mem_info_gtt_used from the amdgpu sysfs. So memory_peak_gb is in all likelihood system-wide used memory, total minus available, and vram_peak_gb the integrated GPU's usage, carve-out and possibly GTT.
That is exactly why a resident workload lands in the number: every other process on the machine is inside it, and no idle baseline is recorded. The lesson is the boring one. Run both backends in the same box state, and if a memory column looks 1.75× off, look at the box before the runtime.
One thing I still haven't checked: whether any of this changes at a smaller context than 131,072, since a runtime that reserves for the full context would show up as a flat offset.
On units: lemonade reads kilobytes, and its ram_gb: 94.05 matches the host's 96,308 MiB to two decimals only if the field is GiB. Read every memory figure here as GiB wearing a GB label.
lemonade recorded vram_gb: 32.0 and ram_gb: 94.05. Both are true readings and neither is a capacity. As this machine was configured for the run, the 32 GiB is the BIOS UMA carve-out (mem_info_vram_total), hidden from the kernel; on top of it the amdgpu driver may map another 56 GiB of system RAM through GTT (ttm.pages_limit=14680064, my setting, not a default). The kernel sees 94 GiB, the machine has 128 GiB, and the three numbers are not meant to sum. Your carve-out and GTT limit will differ. And as far as I can tell none of it is where the NPU's buffers live: amdxdna allocates from ordinary system memory through its own path, which is one more reason not to size a carve-out for FastFlowLM.
Noise
How much of this is noise, and what it cannot tell you
Defaults throughout, because a default run is what the next person will reproduce.
- Decode: I trust the sign and roughly the size of the gap. It held across three box states without an overlapping range.
- First token: I trust the direction on the idle box and not the size. The state moved it by more than the runtime did, and HRX's chat runs spread up to 9%.
- The widest single spread across all six runs is HRX chat-long-output TTFT on the performance profile: 1,570.2 to 1,721.6 ms across three runs, on the metric that is noisy anyway.
- Zero failed runs on either backend, 90 of 90.
Not measured: power or thermals, so no tokens per watt; and output quality between backends, which I haven't diffed. The engine libraries differ per backend, so "same model, same silicon" is not a guarantee of identical tokens, and a greedy one-prompt diff is the cheap check.
Reproduce
Run it yourself
Everything is in the abn/amd-npu COPR for Fedora: fastflowlm, fastflowlm-xrt, fastflowlm-hrx, xrt-npu, xrt-plugin-amdxdna, hrx and lemonade-server. Kernel 7.1.12 with the in-tree amdxdna module is what this ran on; other kernels are untested by me. If you run the system lemond service instead of the per-user CLI, its cache is /var/cache/lemonade and the symlink has to go where the serving process looks.
Run both backends in the same box state, on an idle machine, with the power profile pinned. The report page is built from the six JSON files, the printed logs for the per-run values, and a few readings from the host (rpm, xrt-smi, sysfs, dmidecode, the kernel command line) for the versions and the memory layout.
Traps
Three fields in the output that mean something else
| Field | JSON | What is true | Source |
|---|---|---|---|
backends.flm/npu | v1.0.3 | The packaged binary reports FLM v1.0.4. The JSON carries the version lemonade tracks for the FLM tree it manages: the pin in resources/backend_versions.json and the version.txt beside the wrapper, both v1.0.3. | flm --version, the pin file |
timestamp | 2026-09-03T21:17:38Z | Local time with a Z suffix. The host clock was CEST; that run started at 19:17:38 UTC, and the same two-hour shift applies to all six stamps. | file mtimes, host clock |
gpu[0].vram_gb | 32.0 | The BIOS carve-out as set in firmware for that boot, on a 128 GiB unified-memory machine. See the memory section. | sysfs mem_info_vram_total |
Resources
What this leans on
- FastFlowLM, the inference runtime for AMD NPUs. Version 1.0.4, git bf7fe0e.
- Xilinx Runtime (XRT), 2.26.95, with the amdxdna plugin.
- ROCm hrx-system, HIP Runtime Extended. Packaged from the
amdxdna-hal-native-relbranch at 6867cba; FastFlowLM's own pin is theflm-hrx-amdxdna-v2026.07.30release onjtuyls/hrx, built at eb0b39f. - lemonade, 11.9.0, and its
lemonade benchcommand. - abn/amd-npu COPR, every package used here.
- The report page, every number with its provenance tag and the caveats in full.